DAS
Full signal-chain visibility across head-ends, remotes and repeaters, in real time.
Explore →From stadiums and commercial buildings to hospitals, data centers and fiber networks, ECMonitor adapts to the monitoring demands of different environments, each with its own infrastructure, operational priorities and performance requirements.
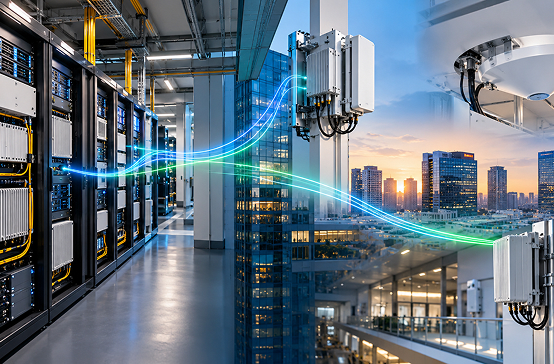
Full signal-chain visibility across head-ends, remotes and repeaters, in real time.
Explore →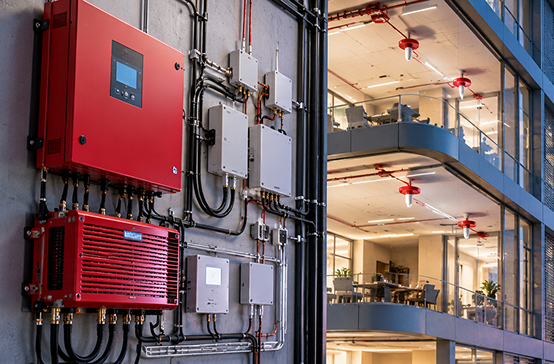
Class A and B BDA monitoring with detection, remote control and compliance reporting.
Explore →
Continuous visibility across fiber paths and the transport that critical services ride on.
Explore →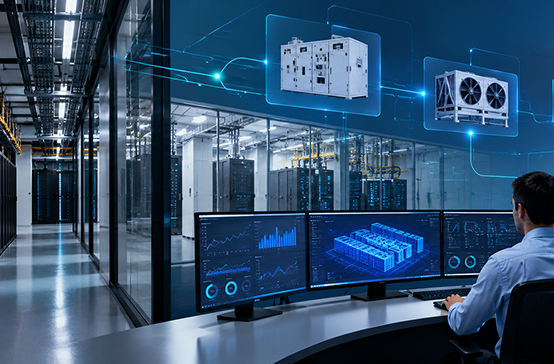
AI-native, vendor-neutral monitoring across power, cooling, network and connectivity, the neutral layer over the DCIM and BMS systems you already run. The same engine, pointed at the largest infrastructure market.
Explore →A DAS spans a head-end, optical transport and dozens of remotes across a venue, often from more than one OEM. When something drifts, the first sign is usually a coverage complaint, long after the cause appeared in the signal chain. Manual checks and vendor portals do not scale across a multi-building deployment.
When a head-end drops, every remote behind it alarms at once. ECMonitor recognizes they share a head-end, folds them into one incident with the likely cause attached, and routes it to the right engineer. Press the button in the worklist to see it happen.
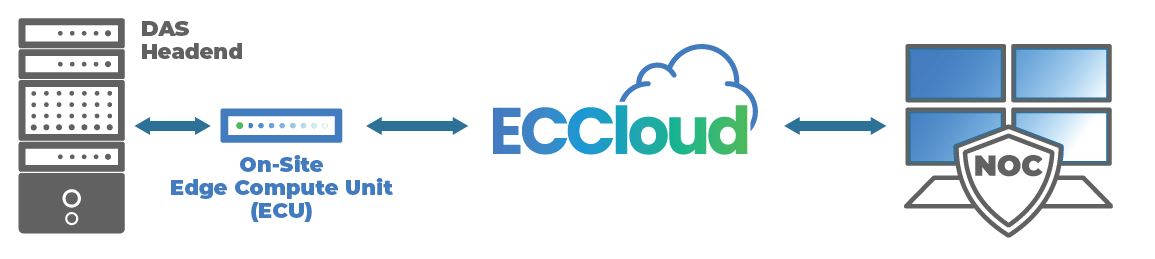
The Edge Compute Unit connects locally to the DAS head-end, discovers the topology and tunnels only the signal to ECCloud. No inbound firewall changes, no VPN. Engineers reach the OEM interface through the same tunnel.
Public safety BDA and ERCES systems are life-safety infrastructure. A dead battery, a drifting signal or an offline BDA is both a safety risk and a compliance failure. Annual testing tells you the system worked once; continuous monitoring tells you it is working right now.
Real-time status of every monitored system and fully logged, controlled ON/OFF actions.
Multi-site portfolios in one view, AI-assisted triage, ticketing that connects to what you run.
Continuous visibility between inspections and defensible records of outages.
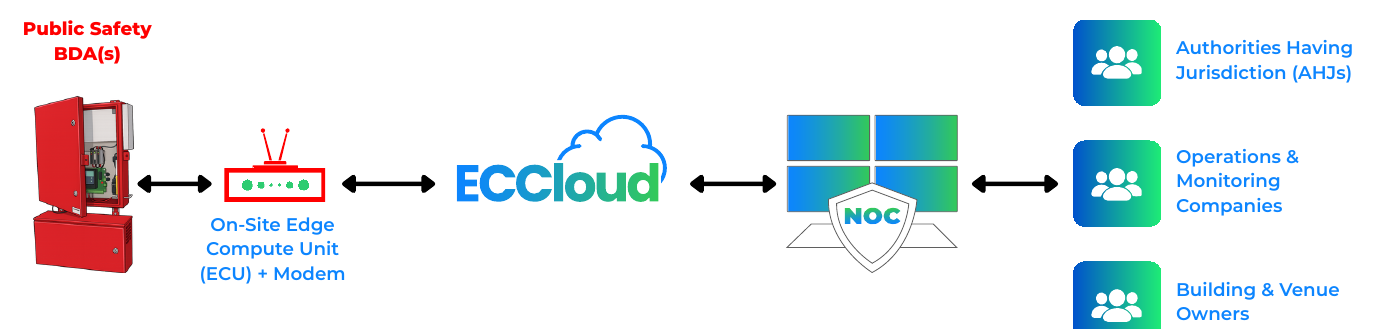
Specific code references (NFPA 72, IFC 510) vary by jurisdiction and adopted edition. Confirm requirements with your AHJ; ECMonitor supports the monitoring and reporting, not the code interpretation.
When fiber or optical transport degrades, the symptoms scatter across every service that depends on it: RF remotes, public safety links, IT connectivity. Monitored in isolation, each looks like its own problem. Monitored together, the pattern points straight at the transport layer.
Power, cooling, network and connectivity: the physical layer of a data center runs on gear from a dozen manufacturers that do not talk to each other. ECMonitor sits across all of it, in one console, without ripping anything out. The same engine covers the fiber between halls and the DAS the campus needs for 5G connectivity on public or private wireless.
Facilities runs power and cooling on one system; IT runs servers and network on another. A single fault can surface as three alarm storms in three tools. That was tolerable at 10 to 20 kW per rack. As AI workloads push densities toward 100 kW and beyond, the seam is where outages hide.
Connectors speak each device's native protocol, SNMP, Modbus, BACnet, MQTT and OPC-UA, and normalize everything into one model. An on-site edge unit and secure tunnel unify what is already installed. No rip-and-replace, no vendor lock-in.
Topology-aware grouping collapses related alerts, same feed, same loop, same root cause, into a single incident with an AI-drafted summary. Fewer unplanned outages, faster resolution.
No. It is a vendor-neutral monitoring layer that sits across the DCIM, BMS and standalone systems you already run, unifying them into one view rather than replacing any of them.
SNMP, Modbus, BACnet, MQTT and OPC-UA. Power and cooling gear often speaks Modbus or BACnet, IT and network devices speak SNMP, and newer sensors use MQTT, all normalized into one model.
Yes. Gear from different manufacturers appears side by side in one console, and a fault plus its downstream effects surface as one correlated incident.
Yes. ECMonitor sits across an existing BMS and DCIM rather than replacing them, closing the gap where facilities and IT systems normally do not share data.
Yes. The vendor-neutral engine is proven across public safety, DAS and fiber, and it is available for data center deployments today.
If it has devices that report telemetry, the engine can likely reach it. Tell us what you run.